
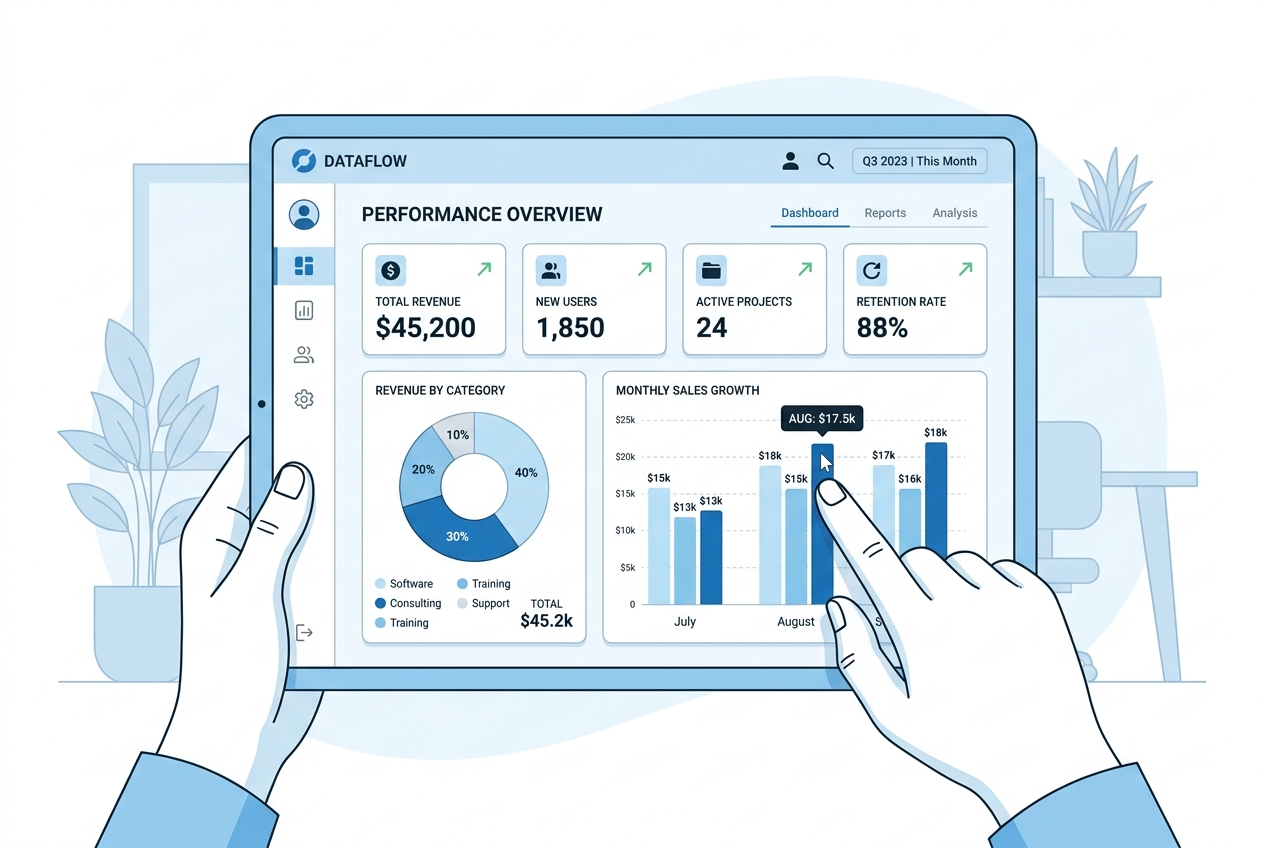
Why Your Power BI Portfolio Matters
If you want to land a data analyst job, certificates and resumes are no longer enough. Hiring managers want to see what you can build. They want to look at your dashboards, interact with your filters, and understand how you solve real business problems with data.
A good portfolio should show that you can clean dirty data, write optimized DAX measures, design intuitive layouts, and extract actionable business insights. Here are three high-impact Power BI projects you should build for your portfolio.
Project 1: Executive Sales & Profitability Dashboard
This project demonstrates your ability to build a comprehensive dashboard for C-suite executives, tracking revenue, margin, and regional performance.
- The Scenario: A global retail company needs to monitor its sales performance across multiple channels, regions, and product categories.
- Key Skills Showcased:
- Data Modeling: Creating a star schema with fact tables (Sales) and dimension tables (Customers, Products, Geography, Calendar).
- DAX Formulas: Writing measures for Year-over-Year (YoY) Sales Growth, Running Totals, Profit Margin %, and Top N Products.
- UI/UX Design: Implementing clean layouts with KPI cards, summary charts, and navigation buttons.
- Real Data Source: You can use the classic AdventureWorks or Northwind datasets, or download clean transactional retail datasets from Kaggle.
Project 2: Customer Churn & Cohort Analysis
This project shows that you can help subscription or SaaS businesses identify which customers are leaving (churning) and why.
- The Scenario: A subscription-based service wants to analyze customer retention trends and target groups that have high churn rates.
- Key Skills Showcased:
- Advanced Data Cleaning (Power Query): Cleaning subscription dates, handling missing values, and formatting customer cohorts.
- Time Intelligence DAX: Creating cohort groups and calculating churn rate dynamically based on inactive months.
- Visual storytelling: Using a cohort matrix heatmap and slicers to isolate customer segments (e.g., tenure, billing plan).
Project 3: Financial Performance & Balance Sheet Report
This project proves you can tackle complex financial data layouts, which is a major asset for finance and consulting roles.
- The Scenario: A company needs to convert raw double-entry accounting ledger tables into a clean, interactive Balance Sheet and P&L statement.
- Key Skills Showcased:
- Custom Financial Layouts: Formatting rows dynamically to show operating expenses, gross margins, and net income lines.
- Dynamic Slicers: Letting users toggle between currency rates, quarters, or subsidiaries.
- Detail Tables: Building drill-down transaction tables so analysts can inspect the individual ledger items behind any balance line.
Tips for Publishing Your Portfolio
- Host on NovyPro or GitHub: Since publishing to the web on Power BI Service requires a work account, you can create a free NovyPro profile or host your screenshots, data models, and DAX codes on a GitHub repository.
- Write a Case Study: Don't just upload the
.pbixfile. Write a short explanation of the business problem, your dataset, your data modeling approach, and the key insights you discovered. - Keep Design Clean: Avoid using too many bright colors or confusing chart types (like 3D pie charts). Stick to a professional color palette and use plenty of white space.