
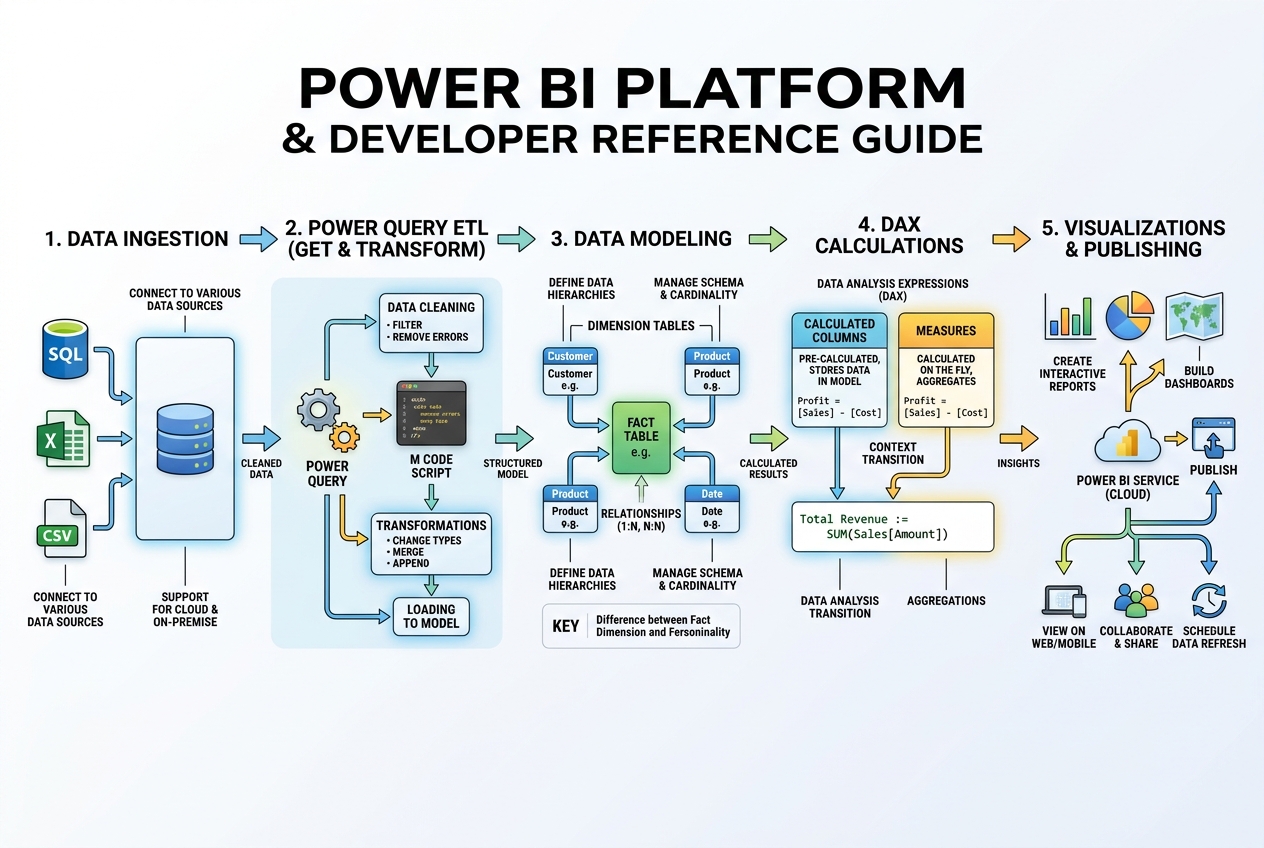
The Power BI Lifecycle: End-to-End
To build successful enterprise analytics solutions, you must master the complete Power BI lifecycle. Many developers struggle because they build "half-baked" reports—ignoring correct relationship cardinality, leaving default settings active that slow down models, or writing inefficient DAX.
This reference guide is designed as a complete developer handbook. It covers the end-to-end process of taking raw source data and turning it into clean, interactive, decision-ready dashboards.
📘 Download the Complete 60-Page PDF Handbook
You can download the full, high-resolution, print-ready PDF edition of this reference manual directly from our Gumroad Page.
🎁 Get it 100% FREE: We want to support developers in their learning path. Simply send us a DM on Instagram (@rpavault) asking for the voucher code, and we'll send you a 100% discount link, honestly!
1. Business Intelligence & Data Warehousing
Before opening Power BI Desktop, you must understand the flow of data in a modern enterprise:
- Business Intelligence (BI): The technology-driven process of analyzing data and presenting actionable insights to help executives make informed business decisions.
- Data Warehouse (DWH): A centralized repository that pools data from multiple transactional systems (databases, CRM, ERP).
- ETL (Extract, Transform, Load): The pipeline used to migrate data from transactional sources into the Data Warehouse.
- Extract: Pulling raw data from source systems.
- Transform: Cleaning, deduplicating, and formatting the data.
- Load: Inserting the cleaned data into target database tables.
A Business Intelligence tool like Power BI sits at the very end of this lifecycle, connecting directly to the Data Warehouse (or raw databases) to query and visualize the aggregated data.
2. Crucial Default Settings to Change
When you launch Power BI Desktop for the first time, several default options are enabled that can slow down your reports and create incorrect relationships. Change these settings immediately under File ➔ Options and Settings ➔ Options:
- Disable Auto-Detect Relationships: Under Data Load, uncheck "Import relationships from data sources on first load" and "Auto-detect new relationships after data is loaded." Letting Power BI guess relationships based on matching column names often creates incorrect links and loops. Always build your relationships manually.
- Set Regional Settings: Under Regional Settings, ensure it matches your target user base (e.g., English (United States)) to prevent date format parsing errors when reading CSV or text files.
- Turn Off Unused Preview Features: Under Preview Features, uncheck any experimental items you are not actively using to maintain application stability.
3. Data Ingestion & Connection Modes
Power BI allows you to ingest data from hundreds of sources (Excel, SQL Server, Web, JSON, Salesforce) using the Get Data icon. When connecting to databases like SQL Server, you must choose between two connection modes:
| Feature | Import Mode | DirectQuery Mode |
|---|---|---|
| Data Storage | Data is compressed and loaded into Power BI's in-memory storage. | No data is stored in Power BI; it stays in the source database. |
| Query Engine | In-memory VertiPaq engine (extremely fast). | Queries are translated to native SQL and run on the source database. |
| Data Freshness | Refreshed on a schedule (e.g., daily or hourly). | Real-time. Every click on a chart triggers a live SQL query. |
| Limitations | File size is capped (1GB for Pro). | Slow performance if the source database is not optimized. |
Recommendation: Use Import Mode for 90% of your reports due to its massive speed advantage. Only use DirectQuery if you require real-time data or have datasets exceeding memory limits.
4. Power Query Data Transformation (ETL)
Power Query is the data preparation engine in Power BI. You can open it via Home ➔ Transform Data. Power Query records every cleaning step you make in the Applied Steps panel, writing the transformations behind the scenes in M Code (a functional programming language).
Key operations you must master:
- Merge Queries: Joins two tables side-by-side based on a matching key column (equivalent to a
JOINin SQL orVLOOKUPin Excel). - Append Queries: Stacks two or more tables on top of each other (equivalent to a
UNIONin SQL). The tables must share the same column structure and data types. - Applied Steps Audit: Since Power Query does not have an "Undo" button (Ctrl+Z does not work in the editor), you edit or revert changes by deleting steps in chronological order from the Applied Steps list.
- Include in Report Refresh: Right-click a query to deselect "Include in Report Refresh" for static lookup tables (like a list of country codes) that never change. This speeds up your schedule refreshes significantly.
5. Data Modeling & Schema Design
Data modeling is the process of defining how your tables relate to one another. A clean data model is the foundation of high-performance reports.
Star Schema vs. Snowflake Schema
- Star Schema (Best Practice): A model where a central Fact Table (containing numeric transactions/metrics) is directly surrounded by independent Dimension Tables (containing descriptive attributes, like Customers or Products).
- Snowflake Schema: A variation where dimension tables are normalized and split into secondary lookup tables (e.g.,
Products ➔ Sub-Categories ➔ Categories). This reduces redundancy but increases join complexity and slows down queries. Try to denormalize your dimensions into a flat Star Schema.
Relationship Mechanics
- Cardinality: Defines the relationship density:
- One-to-Many (
1:*): The standard relationship where a key is unique in the lookup/dimension table and appears multiple times in the fact table. - Many-to-Many (
*:*): Avoid where possible as it introduces ambiguity and can produce unexpected filter results.
- One-to-Many (
- Cross Filter Direction:
- Single (Best Practice): Filters flow downstream from the Dimension (One side) to the Fact (Many side).
- Both: Filters flow in both directions. Avoid this as it causes circular dependencies, performance lag, and incorrect aggregation summaries.
- Active vs. Inactive: You can only have one active relationship between two tables. If you have multiple date columns (e.g.,
OrderDateandShipDatelinked to aCalendartable), the secondary relationship remains dotted (inactive) and must be invoked in DAX usingUSERELATIONSHIP(). - Hiding Foreign Keys: In the Model View, hide foreign key columns (like
CustomerIDon the Fact table) from the report view. This forces users to use the primary fields in the dimension tables, preventing mismatched filter selections.
6. DAX Essentials (Calculated Columns vs. Measures)
Data Analysis Expressions (DAX) is the formula language of Power BI. You apply DAX using two primary structures:
| Attribute | Calculated Columns | Measures |
|---|---|---|
| Evaluation Time | Calculated during data load/refresh. | Calculated on-the-fly when a visual renders. |
| Storage Cost | Stored in RAM, increasing model size. | Consumes no storage space; computed in memory. |
| Context Type | Evaluated row-by-row (Row Context). | Evaluated based on active dashboard filters (Filter Context). |
| Typical Use Case | Categorical slices, bucketing, or key concatenation. | Aggregations (e.g., SUM, AVERAGE), KPI metrics. |
Implicit vs. Explicit Measures
- Implicit Measures: Created when you drag a raw numerical column (like
SalesAmount) directly into a visual and select a default aggregation (Sum, Average) from the drop-down. - Explicit Measures (Best Practice): Written manually using DAX (e.g.,
Total Revenue = SUM(Sales[SalesAmount])). Explicit measures are global, can be reused inside other complex DAX formulas, and are required for advanced time-intelligence calculations.
Variables in DAX (VAR / RETURN)
Always use variables to make your code cleaner and faster:
YOY Growth =
VAR CurrentSales = [Total Sales]
VAR PriorSales = CALCULATE([Total Sales], SAMEPERIODLASTYEAR('Calendar'[Date]))
RETURN
DIVIDE(CurrentSales - PriorSales, PriorSales, 0)
Benefits: Variables are evaluated once, preventing Power BI from running the same sub-calculation multiple times, which boosts performance.
7. Reports & Visualizations
Visual Types & Selection
- Card/KPI: Displays a single critical number (e.g.
$1.6MTotal Revenue). - Matrix: Similar to an Excel Pivot Table; displays nested rows and columns.
- Decomposition Tree: An AI visual that breaks down a metric by multiple dimensions (e.g., showing how sales are divided by Category, then Region, then Manager).
- Q&A: Allows users to query the dataset using natural language (e.g. "Show total sales by region as a bar chart").
Report Interactions
By default, clicking a segment in one chart highlights or filters all other charts on that page. If you want to disable this behavior for specific visuals, select a chart, go to Format ➔ Edit Interactions, and select the None icon on the target charts.
8. Reports vs. Dashboards
In Power BI, "Report" and "Dashboard" represent two completely different structures:
- Power BI Report: Built in Power BI Desktop. Can span multiple pages, contains interactive slicers, drill-through filters, and is bound to a single dataset.
- Power BI Dashboard: Created only in the cloud-based Power BI Service. It is a single-page screen made by pinning "tiles" (individual visuals) from different reports. Dashboards do not support interactive slicers or page navigation; clicking a tile redirects you back to the parent report.
9. Publishing & Sharing
Once your model and visuals are complete, you publish the report to make it available to your organization:
- Publish: Click Publish on the Home ribbon in Power BI Desktop.
- Select Workspace: Choose your target workspace in the Power BI Service (requires signing in with an official corporate email; personal accounts like Gmail are not supported).
- Configure Gateway: Set up a Power BI Gateway in your cloud environment to link the published report back to your local or on-premises SQL databases for scheduled data refreshes.